Let's See How They Improved By Using Our Products
Learn how our customers increase their leads and revenue through personalization and many other features. Check their stories!
Report Flow Campaign
Here you will learn about reports in Flow Campaign. We have provided reports visualization that make it easier for you to understand the incoming data in the form of Scenario Tree and Data Flow. Here are some explanations.
In the Scenario Tree model, you will see exactly the same as the scenario that has been created. So it will be easier for you to know at which stage the data is entered. Like the example image below.
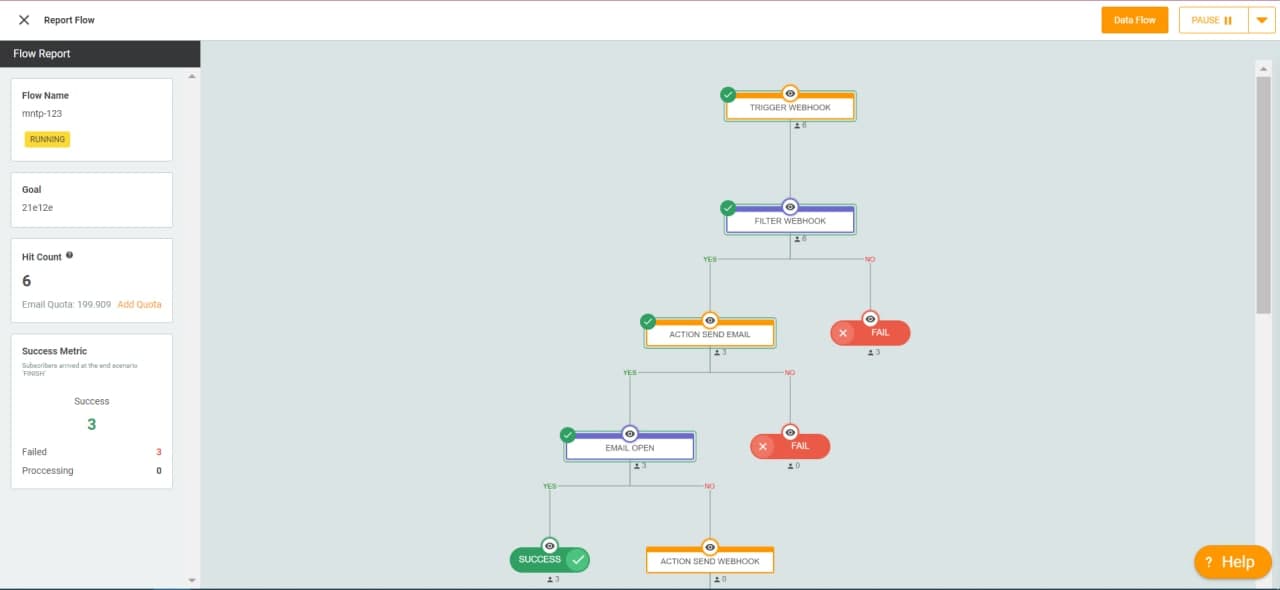
There are several terms you need to know here.
processing stage (Data is still waiting for a response from the recipient or is still being processed by the system), success (Data has entered the success scenario) or fail (Data entered the failed scenario).How can data be said to be success or fail?
The data entered in the metric based on your scenario.
For more details, click the Action icon on the node to find out the details of the data entered in the Flow Campaign


The Data Flow model will display the latest activity from each email data as shown in the example below.

So the data that appears here is the latest activity from each email data that matches your Flow Campaign.

Here you will get detailed information for each data entered, such as Step History which contains the history of data that has reached any stage and Step Description (which can be clicked based on Step History) which contains details of each history.